> For the complete documentation index, see [llms.txt](https://www.opal-rt.com/docs/llms.txt). Markdown versions of documentation pages are available by appending `.md` to page URLs; this page is available as [Markdown](https://www.opal-rt.com/docs/scopeview/get-started/analyze-and-process-acquired-data.md).
# Analyze & Process Acquired Data
After data acquisition, ScopeView displays the results graphically, allowing users to process and analyze the acquired signals. This stage, commonly referred to as **post-processing**, provides tools for visualizing, manipulating, and interpreting your data.
This section describes the methods for accessing post-processing functions. Many of these functions require selecting one or more graphs, so the process for graph selection is also explained.
Most post-processing functions can be accessed from the **toolbar** or the **background menu** of the graphic page area. ScopeView allows actions to be applied to a single graph or multiple graphs at once, using a consistent procedure to select the graphs of interest.

## Select graphs
* **Select individual graphs:** Hold the **Ctrl** key and click each graph. A frame highlights the selected graph. Click again with Ctrl to deselect.
* **Select all graphs:** Use the **Edit Graph** buttons at the bottom-left corner of the window.
* **Deselect graphs:** Use the **Edit Graph** buttons or the menu: **Edit > Select None (Ctrl+Alt+N)**.
## Edit graph pages
ScopeView allows you to edit each graphic page in multiple ways:
* Selecting which **graphic page** to display
* Changing the **graph layout**
* Modifying the **appearance of graphs**
* Editing formulas
* Adding **notes**
* Saving **editing information** (stored in template files)
Use the **Page selection tab** at the bottom of the graphic page to navigate between pages. Click the desired tab to display that page.
### Customized the graph layout
* **Number of columns:** Use the **Number of Columns** buttons at the bottom of the page.
* Maximum: 6 columns, 6 graphs per column. ScopeView prevents selections exceeding this limit.
* **Auto Layout:** Toggle automatic graph arrangement. ScopeView distributes graphs evenly across columns.
* **Moving graphs manually:**
* Drag a graph to another position on the same page, to another column, or to a different page.
* For moving multiple graphs: Select graphs → **Copy** → switch to destination page → **Paste**.
* If no graph is copied before pasting on a new page, ScopeView creates a new page and moves the graph(s).
### Change graph properties
Right-click anywhere on the graphic page to open the **background menu** and select **Graph Properties** to customize the appearance and settings of each graph:
* **Type tab:** Select the line type.
* **X/Y Axis tabs:** Edit axis titles, units, labels, min/max, tick spacing, and precision.
* **Chart color tab:** Customize the color of chart, chart area, and plot area.
* **Line style tab:** Change line color, style, and add symbols with custom size and color.
* **Legend tab:** Show or hide the legend.
* **Header/Footer tabs:** Add text to the top/bottom of the page.
* **Note tab:** Add, position, or remove notes directly on the graph.
### Change page properties
Right-click anywhere on the graphic page to open the **background menu** and select **Page Properties** to customize the page used for acquisition. You can add or modify information and control its display:
* Header tab. Used to display a header title on the top of the page.
* Footer tab. Used to display a footer title at the bottom of the page.

### **Change window properties**
Right-click anywhere on the graphic page to open the **background menu** and select **Window Properties** to view or edit software information, including the software ID, the icon displayed on the graphic page, and the current user ID.

### Change clipboard properties
Right-click anywhere on the graphic page to open the **background menu** and select **Clipboard Properties** to choose the format for copy graphs to the clipboard for printing, pasting, or exporting:
* **Bitmap:** Suitable for Word or standard paste.
* **Encapsulated PostScript (EPS):** Suitable for export to other software.
## Zoom and adjust graph view
Common graphic functions are available through the **toolbar** for quick access:
* **Zoom:** Focus on specific graph regions. Zoom levels are stored and can be reverted.
* **Zoom In:** Click the graph → click **Zoom In** → drag the region of interest.
* **Zoom Out (Last Level):** Reverts one zoom step.
* **Zoom Out (All Levels):** Returns to the original display state.
{% hint style="info" %}
There is almost no limit to the number of horizontal zooms that can be applied to a given curve. The only limit is that at least two points should always be displayed.
{% endhint %}
## Start the acquisition
In addition to the **Play** button on the **Signals** form, the **Main** window provides its own **Play** button to start the acquisition.
---
# Agent Instructions
This documentation is published with GitBook. GitBook is the documentation platform designed so that both humans and AI agents can read, navigate, and reason over technical content effectively. Learn more at gitbook.com.
## Querying This Documentation
If you need additional information that is not directly available in this page, you can query the documentation by asking a question.
Perform an HTTP GET request on the following URL with the `ask` and `goal` query parameters:
```
GET https://www.opal-rt.com/docs/scopeview/get-started/analyze-and-process-acquired-data.md?ask=&goal=
```
`ask` is the immediate question: it should be specific, self-contained, and written in natural language.
`goal` is what the user is ultimately trying to achieve, the reason they need the answer. Sharing it helps GitBook give you a better, more relevant answer. A goal is most helpful when it describes the outcome the user wants rather than restating the question. For example, with `ask=how do I create an API token`, a goal like `automate deployments from our CI pipeline` lets GitBook tailor the answer to that use case.
The response will contain a direct answer to the question and relevant excerpts and sources from the documentation.
Use this mechanism when the answer is not explicitly present in the current page, you need clarification or additional context, or you want to retrieve related documentation sections.


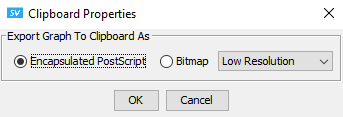 Right-click anywhere on the graphic page to open the **background menu** and select **Clipboard Properties** to choose the format for copy graphs to the clipboard for printing, pasting, or exporting:
* **Bitmap:** Suitable for Word or standard paste.
* **Encapsulated PostScript (EPS):** Suitable for export to other software.
## Zoom and adjust graph view
Common graphic functions are available through the **toolbar** for quick access:
* **Zoom:** Focus on specific graph regions. Zoom levels are stored and can be reverted.
* **Zoom In:** Click the graph → click **Zoom In** → drag the region of interest.
* **Zoom Out (Last Level):** Reverts one zoom step.
* **Zoom Out (All Levels):** Returns to the original display state.
{% hint style="info" %}
There is almost no limit to the number of horizontal zooms that can be applied to a given curve. The only limit is that at least two points should always be displayed.
{% endhint %}
