AI workload variability and its impact on data center power stability
Industry applications, Power Systems
03 / 22 / 2026
Key Takeaways
- AI data centre stability depends on how fast loads move, not only on peak capacity.
- Training, fine-tuning, and inference need separate electrical representations because their power signatures differ.
- Real-time, converter-aware validation is what turns workload variability into a manageable engineering problem.
AI workloads will push data center power stability from a capacity problem into a control problem. The main issue is no longer only how much power a site needs, but how fast that power moves as clustered accelerators shift between compute, communication, checkpointing, and idle states. That matters because data centres already used about 415 TWh of electricity in 2024, or roughly 1.5% of global consumption, and AI is the largest force behind the next wave of growth.
You need models and test methods that treat AI facilities as fast electrical loads with converter-heavy interfaces, cooling feedback, and workload scheduling effects. Stable operation will come from disciplined representation of those behaviours, then checking them under short-timescale disturbances before a project reaches commissioning. Advanced converter simulation platforms can represent complex topologies such as solid-state transformers and high-density voltage source converters with nanosecond-level resolution and support for dozens of converters within a single FPGA.
AI workloads create rapid and unpredictable data center power fluctuations

AI workloads produce short-timescale power swings because the compute stack does not draw power evenly across a job. Training clusters move between matrix operations, communication barriers, memory activity, and checkpoint writes, so the electrical load rises and falls in bursts instead of staying flat.
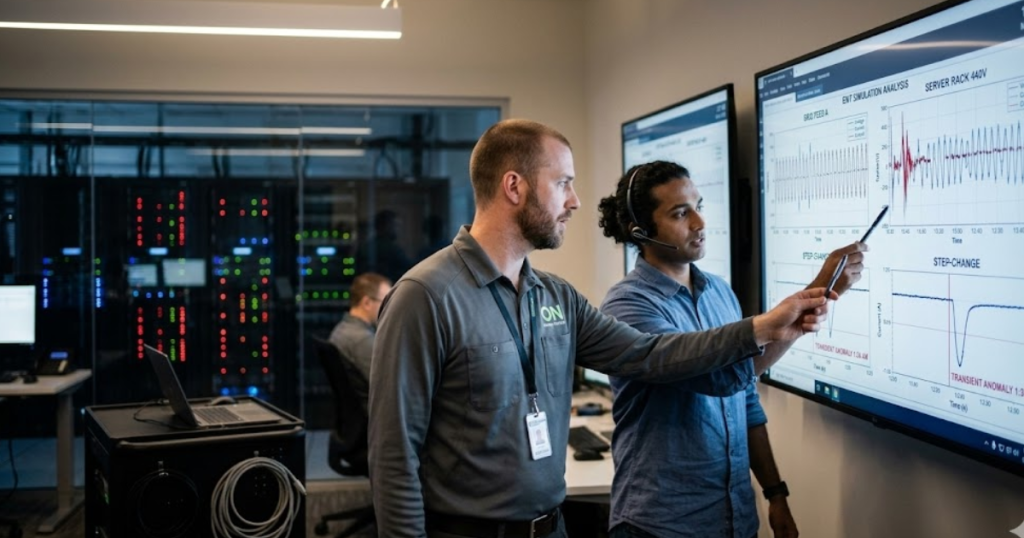
A GPU cluster training a large language model gives you a clear case. During intense computation, server power and cooling demand rise together. Once the job hits synchronization or data movement, the electrical draw can dip, then surge again when the next batch starts. Those transitions matter more than daily average load because switchgear, UPS controls, plant controllers, and grid-facing studies must all handle the ramps, not just the steady state.
You should treat variability as a facility property, not a software detail. Scheduling policies, batch sizing, checkpoint intervals, and cooling response all shape the electrical signature seen at the point of common coupling. A site can look well behaved on a one-minute trend while still creating harmful sub-second stress on internal buses and upstream equipment.
Why traditional load models fail to represent AI data center behaviour
Traditional load models miss AI data centre behaviour because they were built for slower, smoother consumption patterns. Constant-power blocks, static ZIP loads, or coarse time-step demand shapes hide the converter controls, rack-level synchrony, and cooling interactions that govern how an AI site actually behaves during disturbances.
A conventional enterprise server hall often lets planners get away with average load assumptions. An AI hall packed with accelerators does not. The power path now includes rectifiers, DC buses, voltage regulation, fast fans or liquid cooling auxiliaries, and workload orchestration that can line up thousands of devices at once. When a model smooths those actions into a flat megawatt value, voltage excursions, harmonic effects, and recovery behaviour disappear from the study.
You also lose failure visibility. A simplified model will not show how a controller reacts to a short voltage dip, how cooling power lags server heat rejection, or how multiple power-electronic stages interact. That blind spot leads to studies that look clean on paper but fail when the site faces a feeder event, transfer sequence, or abrupt workload shift.
Key electrical characteristics that define AI data center load dynamics
AI data centre load dynamics are defined by power-electronic interfaces, high rack density, short response times, and cooling systems that track IT heat with their own control loops. Those features make the site behave more like a tightly coupled electro-thermal system than a passive commercial load.
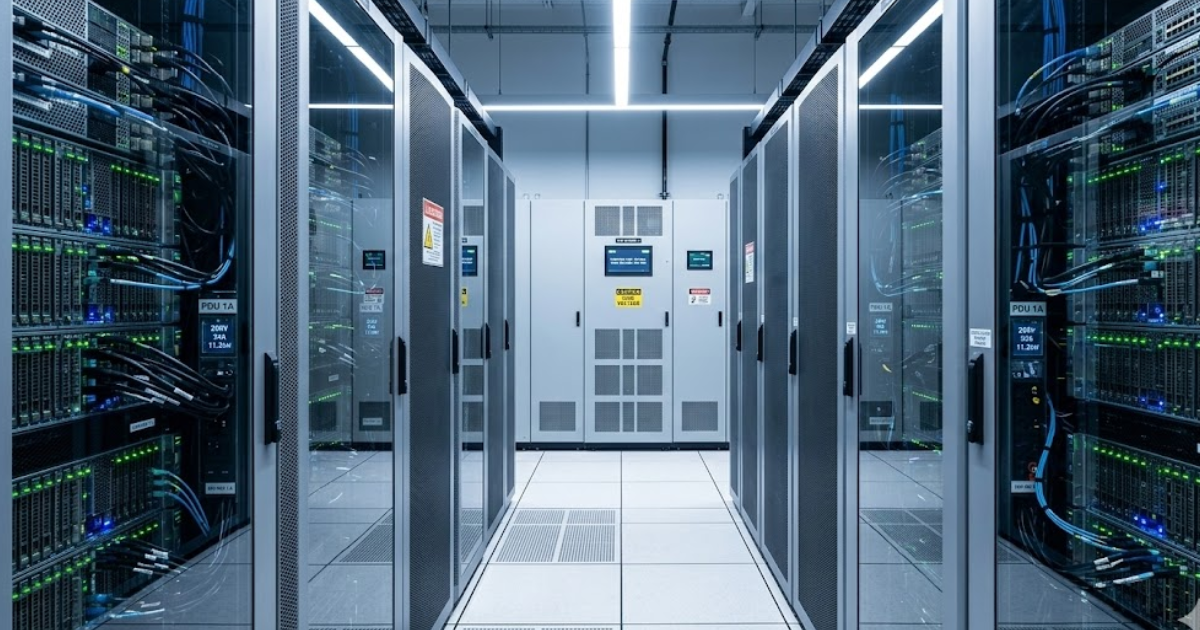
The clearest marker is rack power density. Traditional racks often sit around 7 to 10 kW, while AI racks commonly reach 30 to more than 100 kW, which raises both electrical stress and thermal coupling inside the room.
That shift has practical consequences for your models. Higher density compresses the margin for bus voltage deviation, cooling lag, and breaker coordination. It also means local control actions travel through the site faster. A small timing mismatch between IT load pickup and mechanical or liquid cooling support can produce a brief but important mismatch in total facility demand. Those interactions are exactly why AI load studies need more detail than legacy planning approaches.
How AI training and inference workloads create distinct power patterns
Training and inference create different power patterns, so you should not study them as one blended AI load. Training tends to hold a high baseline with periodic swings tied to compute and communication phases, while inference often shows shorter bursts linked to user or application traffic.
A training cluster running a multi-day model job can sit near high utilization for hours, then spike around synchronization and storage activity. An inference cluster serving enterprise copilots or search augmentation often looks quieter on average, yet it can produce sharp step changes when request volumes bunch up across many GPUs. Fine-tuning sits between those modes, with shorter runs and more intermittent bursts.
“AI workloads produce short-timescale power swings because the compute stack does not draw power evenly across a job.”
| Workload mode | What the power profile usually looks like |
| Pre-training | Power stays elevated for long stretches and swings when compute phases hand off to communication or checkpoint tasks. |
| Fine-tuning | Average draw is lower, but repeated testing and parameter updates create uneven bursts through the run. |
| Inference | Load follows request traffic, so clustered user activity creates fast step changes instead of a long flat plateau. |
| Cooling response | Thermal systems track IT heat with a lag, which means total facility demand can stay high after server power eases. |
| Grid-facing effect | The utility and interconnection model see the combined electrical and cooling response, not only the server trace. |
You will get better design choices once those modes are separated. Transfer logic, UPS sizing, feeder studies, and on-site storage dispatch can then be checked against the pattern each hall will actually run, rather than an average profile that matches none of them.
Power stability risks created by large synchronized AI workload changes
Large synchronized AI workload changes create voltage, frequency, and power-quality risks because many devices move at nearly the same time. The issue is coordination at scale. A site with well-behaved individual racks can still produce a rough system-level response when orchestration aligns thousands of accelerators and cooling assets.
A workload scheduler that starts a new training phase across several halls illustrates the problem. Server power jumps first, cooling and auxiliary systems follow, and the aggregate ramp hits internal distribution and the upstream grid as one event. That can stress transformer tap behaviour, disturb plant-level control loops, and expose weak points in ride-through settings during a nearby voltage sag.
You should also watch the concentration risk. AI data centres tend to cluster in the same regional markets, so local network weakness can amplify what would look manageable in an isolated facility study. Stable power comes from matching facility controls, scheduling limits, and interconnection assumptions to the same disturbance envelope.
Modelling AI-driven load variability in power system studies
Modelling AI load variability well means linking workload states to electrical states. A useful study will represent compute phases, converter controls, cooling response, and site power architecture in one chain, so a workload shift becomes an electrical event with measurable consequences.
A practical model starts with several operating states rather than one averaged demand block. You can map idle, inference burst, fine-tuning burst, sustained training, and transfer events to distinct power signatures, then attach those signatures to the facility topology. That approach lets you test what happens when a hall moves from moderate use to full training while another section stays on inference service.
Execution detail matters here. Modern converter simulation platforms support half-bridge, full-bridge, dual active bridge, and multiple active bridge topologies while executing large numbers of converters inside a single FPGA for fast electromagnetic transient studies. That kind of setup supports EMT-grade work for data centre supply paths rather than forcing the study into slow average behaviour.
Why is real-time simulation required for AI data center load testing
“Real time simulation is required when the study question depends on control timing, converter interaction, or sub-cycle disturbance response.”
Offline averages can estimate energy use, but they will not show how a protection scheme, plant controller, or hardware interface responds during a fast AI load transition.
A transfer from utility supply to on-site backup illustrates the point. The sequence has switching actions, converter responses, and control delays that must be checked in time order. The same applies to a voltage dip on the feeder while AI halls are at high utilization. You need to see whether the site rides through cleanly, how quickly it settles, and which controls interact badly under stress.
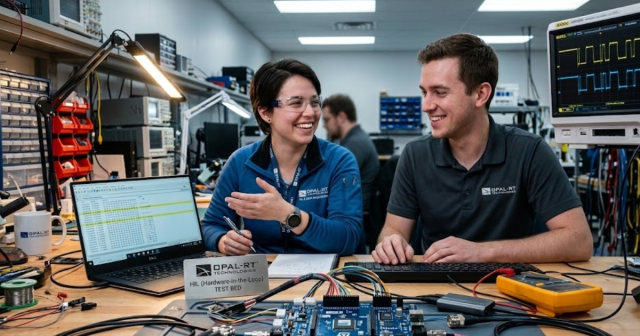
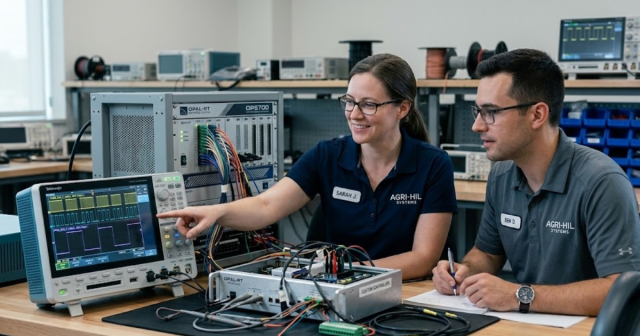
This is where hardware-linked testing becomes useful. OPAL-RT platforms can execute converter-rich electrical models at time steps as small as 40 ns while supporting flexible input/output expansion through high-speed communication links. That makes them suited to checking fast load behaviour with the fidelity AI data centre power paths now require.
Engineering practices used to validate power stability under AI workloads
Power stability under AI workloads is validated with controlled disturbance testing, operating-state coverage, and disciplined model calibration. You need proof that the model reproduces measured facility behaviour before you trust it for interconnection or protection decisions.
A sound validation plan will include these 5 checks:
- Measured rack and hall power traces are compared against simulated traces for the same workload state.
- Voltage sag, source transfer, and load step events are tested at several loading levels.
- Cooling and auxiliary loads are included so facility demand matches total site response.
- Scheduler-induced coincidence is checked so that multiple halls do not hide a harmful aggregate ramp.
- Protection and plant control settings are tuned against fast events instead of average demand.
That process matters because stable performance is earned through repeatable execution. A model that matches steady-state megawatts but misses timing will still send you toward weak settings and poor equipment assumptions. The teams that get reliable results are the ones that keep measurement, EMT modelling, and hardware-linked testing in the same loop. OPAL-RT fits naturally into that closing step because the platform is built around real-time validation, not only offline representation.
Real-time solutions across every sector
Explore how OPAL-RT is transforming the world’s most advanced sectors.
Simulation
03 / 25 / 2026
Integration testing between firmware and physical interfaces
Covers how to plan and run firmware integration testing for physical interfaces using staged loops, HIL protocol simulation, tool selection, and trace-based debugging for CAN and similar buses.
Industry applications, Simulation
03 / 25 / 2026
Real-time simulation of multilevel converters and cascaded topologies
A practical guide to multilevel converter simulation that explains how cascaded H bridge models are partitioned across CPU and FPGA resources for accurate real-time EMT and hardware in the loop testing.

Simulation
03 / 23 / 2026
Scaling from academic HIL setups to industrial validation platforms
Practical guidance for moving an academic HIL system from an entry level FPGA real time simulator to a modular platform that supports scalable real time simulation, repeatable tests, and traceable industrial validation results.
EXata CPS has been specifically designed for real-time performance to allow studies of cyberattacks on power systems through the Communication Network layer of any size and connecting to any number of equipment for HIL and PHIL simulations. This is a discrete event simulation toolkit that considers all the inherent physics-based properties that will affect how the network (either wired or wireless) behaves.